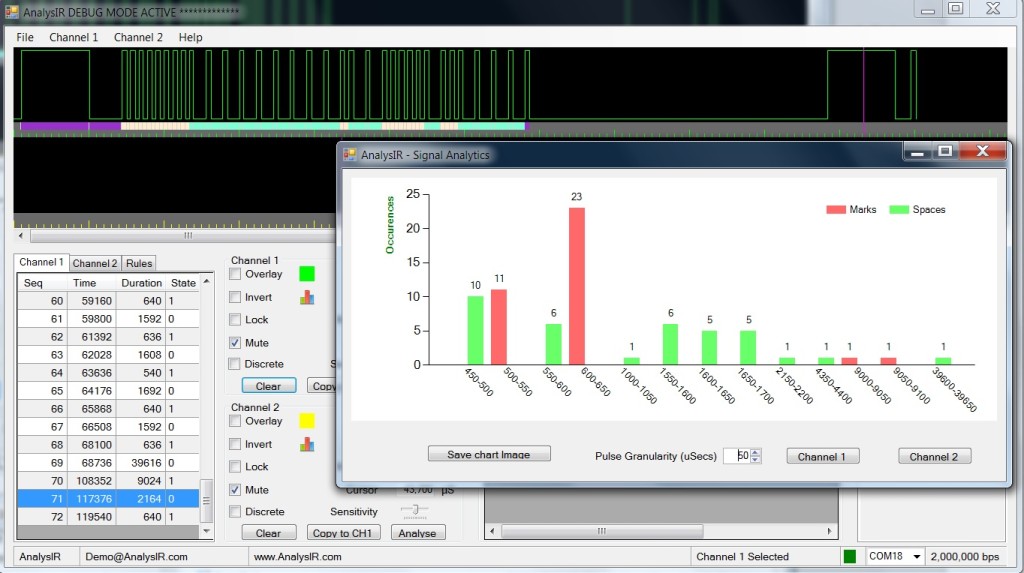
Today we have added another bonus feature to AnalysIR – a colour coded chart which displays the distribution of Marks & Spaces of an IR signal, including an option to select the granularity of each time slot measured (from 10 to 1,000 uSecs). We have included a screenshot below of an NEC signal at 50 uSecs time slots and the chart shows the number of Mark/Spaces for each time range found.

This feature has a number of potential uses:
– Makes decoding new protocols easier, because you get a quick analysis of the pulse lengths (marks & spaces) in the signal.
– Can immediately show problems with your IR receiver, transmitter, encoding or decoding circuit/logic. For example, in the chart above the space for a ‘1’ bit should be 1,690 uSecs and it’s shown on the graph as being spread out between the 1550 to 1700 time slots. This is not normally a big issue as most decoders will allow a reasonable margin of error when decoding, but it can help to highlight issues when designing.
– Using the image save option means you can export the chart and use in reports, blogs or presentations.
Thanks again to all our backers who used the IGG referrals option for AnalysIR. It has had a real impact. (We are now ranked in the top 10 Technology projects on IGG which have reached over 75% of target! – ahead of many bigger projects Keep sharing your AnalysIR referral link. See earlier post re referrals)
And finally, keep your feature suggestions coming!
PS: You should be able to zoom in/out of an image using CTRL ‘+’, CTRL ‘-‘ or CTRL ‘0’ in most desktop browsers.